Solana Breaks $116 Support as U.S. ETFs See Outflows
Solana fell below $116 support as U.S. spot SOL exchange-traded funds recorded three consecutive sessions of net outflows totaling $17.7 million.
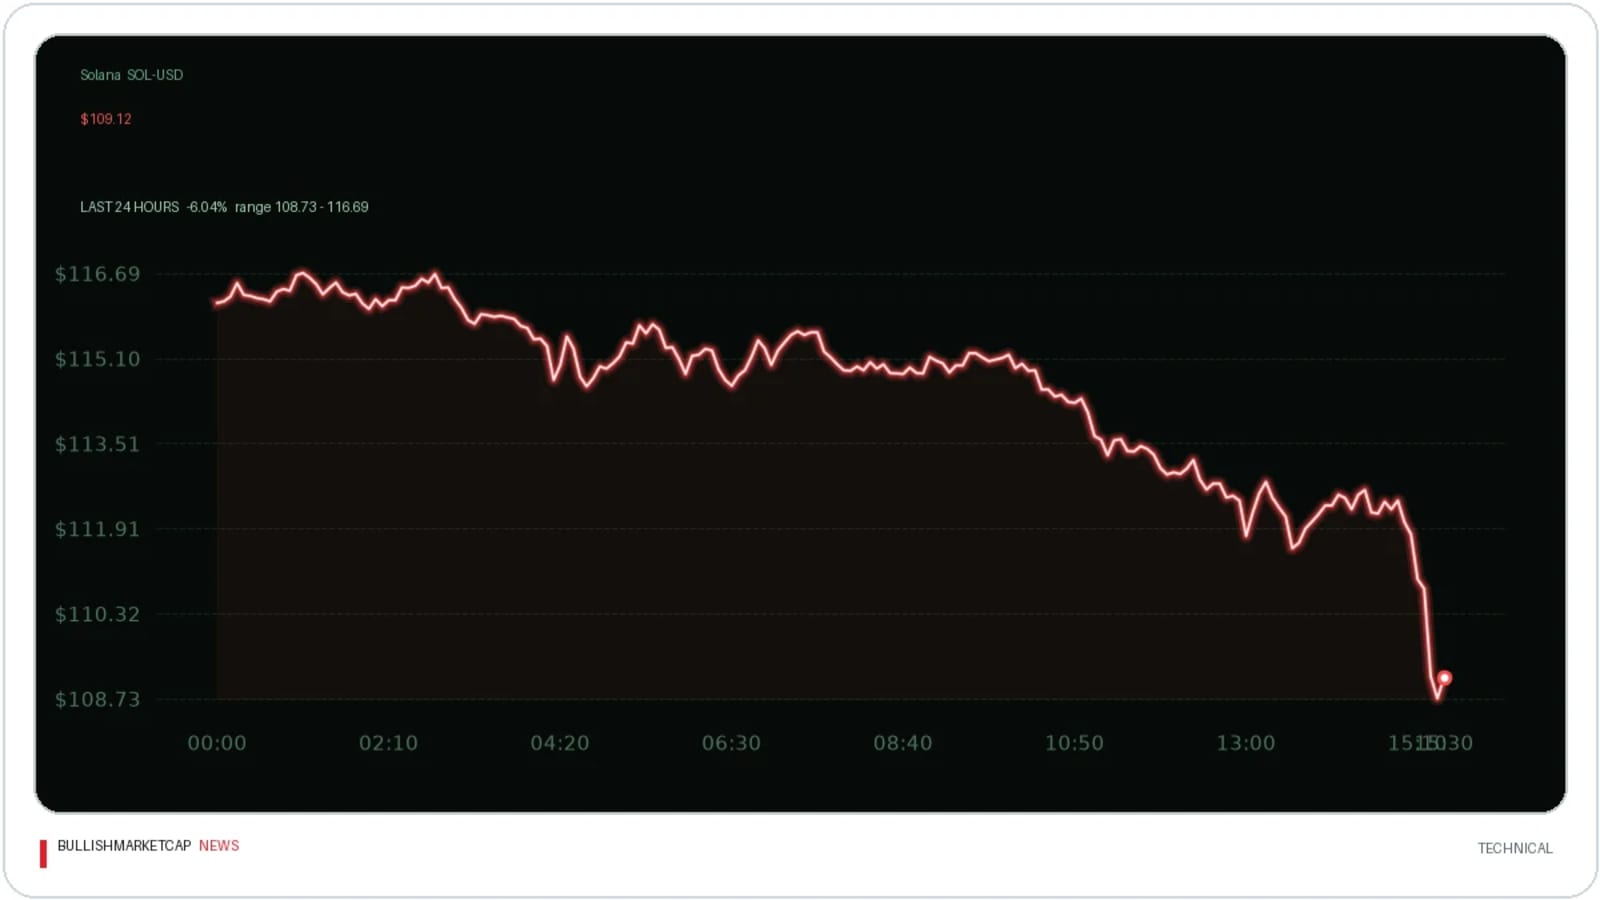
Solana ($SOL) traded near $112.28, declining 3.46% from the session's opening price on Oct. 8, after breaking below the key $116 support level, according to CryptoNews. The move followed an intraday high of $116.81 and a low of $111.21, extending a retreat from the late-September and early-October trading range between $120 and $125.
ETF Outflows and Technical Indicators
Instant Telegram notifications for large on-chain moves.
According to data from SolanaFloor cited by CryptoNews, U.S. Solana ETFs recorded approximately $17.73 million in net outflows across three consecutive sessions. Withdrawals included $9.24 million on Oct. 5, $3.69 million on Oct. 6, and $4.8 million on Oct. 7. Despite the redemptions, cumulative net inflows stood at approximately $1.6 billion with $1.86 billion in assets under management across the tracked funds as of Oct. 7.
On the technical charts, TradingView data showed the daily Supertrend support line at $107.22, maintaining a green and positive daily trend signal despite weakening momentum shown by the daily Awesome Oscillator. However, short-term indicators on the 4-hour chart deteriorated, with Chaikin Money Flow falling to -0.17 and price trading beneath the lower Bollinger Band at $112.94.
Downside Levels and Resistance
Market analysts identified $110 and $106 as the next downside levels if buyers fail to reclaim the lost support. Analyst Sujal noted that buyers must push SOL back above $116 to avoid a deeper correction toward $106, while commentator BitGuru pointed to $113 and $110 as immediate levels to watch. On the upside, resistance spans from the former $116 level to the Bollinger middle band at $118.16 and overhead liquidation concentrations near $122 to $125.
Key facts
- Solana traded at $112.28 on Oct. 8, down 3.46% for the session after breaking $116 support.
- U.S. Solana ETFs registered approximately $17.73 million in net outflows across three consecutive sessions.
- Cumulative net inflows across tracked Solana funds stood at roughly $1.6 billion with $1.86 billion in assets as of Oct. 7.
- Daily Supertrend support was positioned at $107.22, while analysts identified downside targets at $110 and $106.
Source: crypto.news
This article is for information only and is not investment advice. BullishMarketCap news is produced with AI assistance from public sources and reviewed by our editors; see our editorial policy. Spotted an error? Tell us.