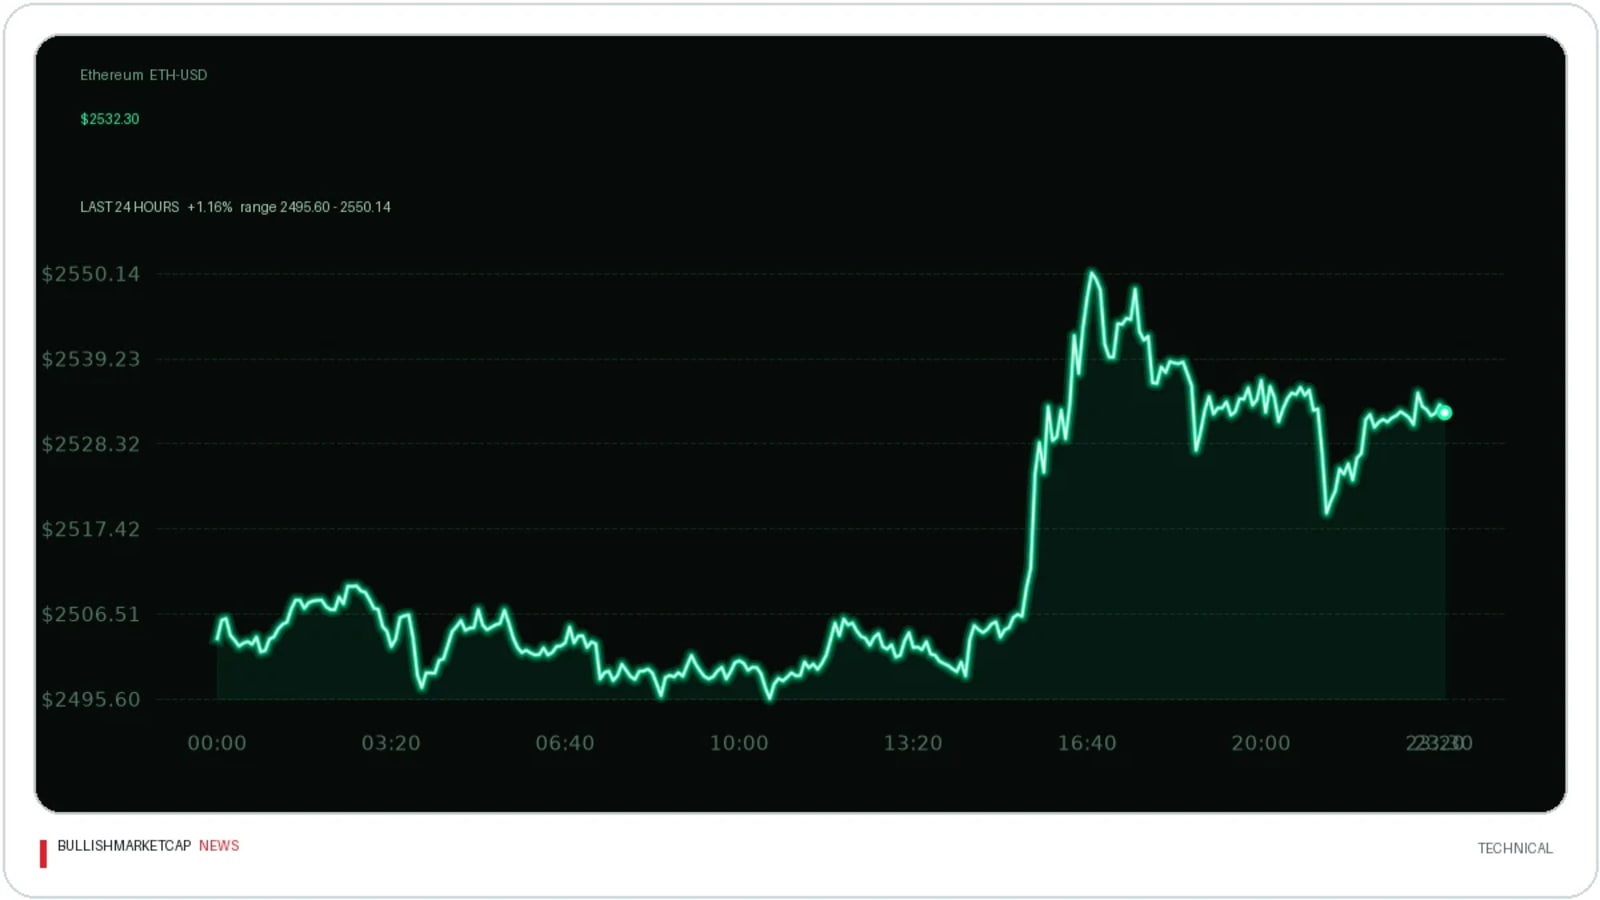
Ethereum Tests Resistance Zone as Market Eyes $2,700 Level
Ethereum recovered toward $2,530 after a recent slide, but faces technical resistance between $2,560 and $2,575 before any potential rally.
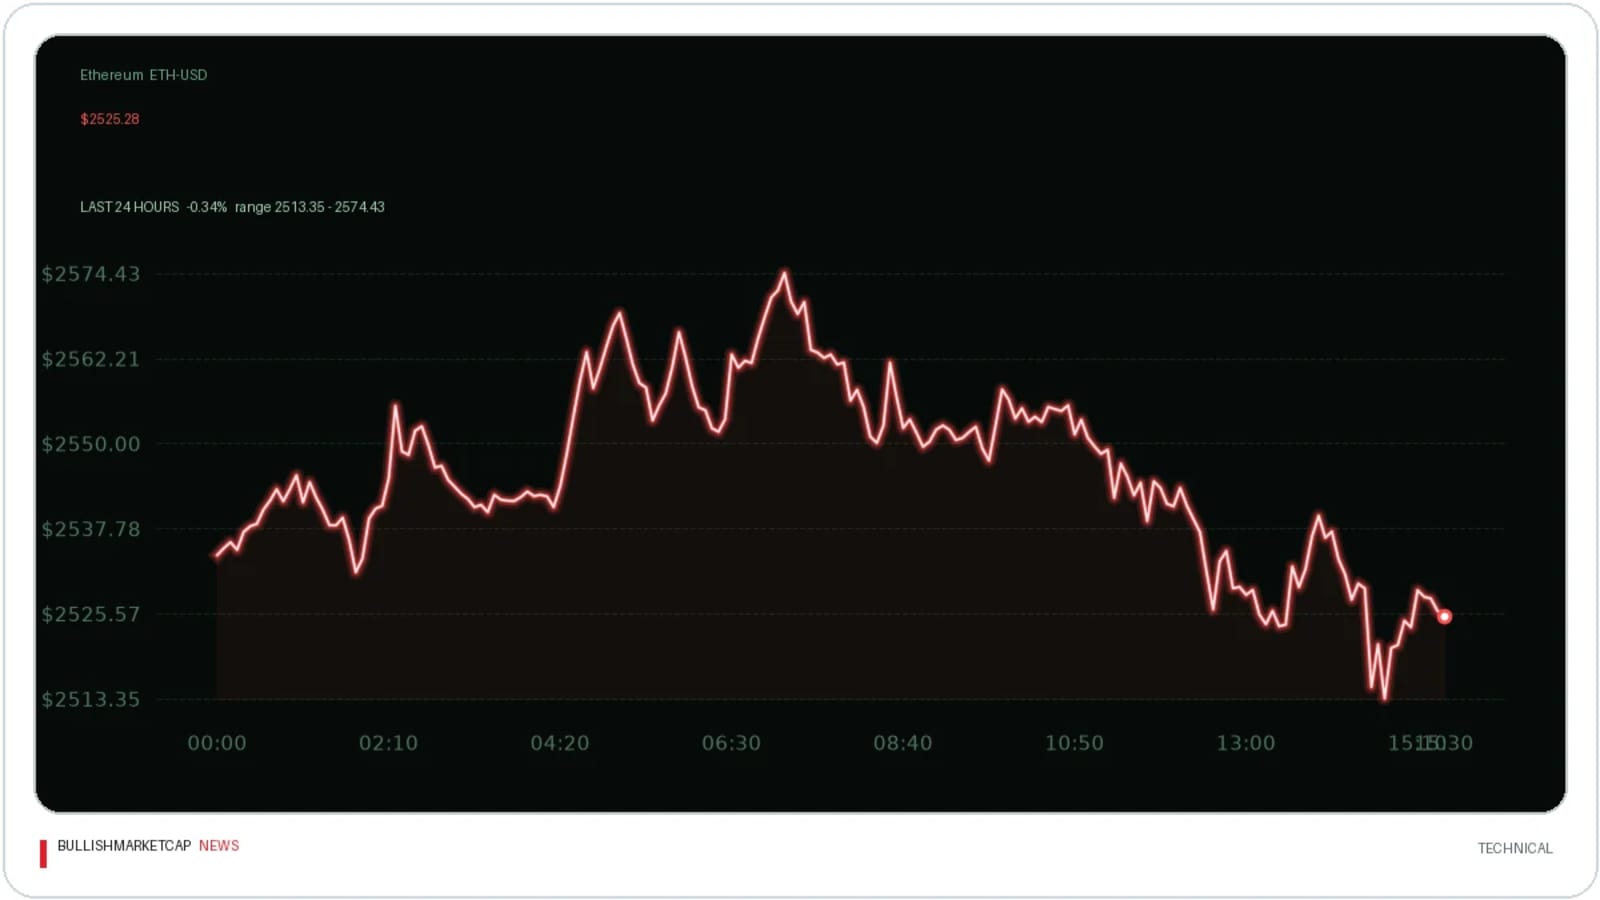
Ethereum ($ETH) traded near $2,530 following a recovery from last week's sell-off, remaining below its daily 20-day and 50-day moving averages, according to CryptoNews. The daily chart recorded a session high of $2,579.88 before pulling back.
Technical Hurdles and Moving Averages
Instant Telegram notifications for large on-chain moves.
On TradingView's daily chart, Ethereum's 50-day simple moving average stood at $2,558.10, while the 20-day average was positioned higher at $2,640.41. The 4-hour chart placed the upper Bollinger Band near $2,559.97, aligning closely with the 50-day moving average and creating an immediate technical barrier between $2,558 and $2,560. Analysts Ted Pillows and Michaël van de Poppe identified the $2,560–$2,575 range as an essential recovery threshold.
ETF Outflows and Liquidation Clusters
Farside Investors recorded $542.2 million in net withdrawals from US spot Ethereum exchange-traded funds during October 5–9, marking a continuation of negative sessions. Meanwhile, CoinGlass data showed large overhead liquidation concentrations near $2,585, $2,635–$2,640, and $2,740, with the closest band sitting directly above the analysts' resistance zone.
Key facts
- Ethereum traded near $2,530 on the daily chart following a retreat from the $2,700 region.
- Resistance was identified between $2,560 and $2,575 by analysts Ted Pillows and Michaël van de Poppe.
- US spot Ethereum ETFs recorded $542.2 million in net withdrawals from October 5 to 9.
- CoinGlass liquidation heatmaps showed concentrated bands near $2,585 and $2,635–$2,640.
Source: crypto.news
This article is for information only and is not investment advice. BullishMarketCap news is produced with AI assistance from public sources and reviewed by our editors; see our editorial policy. Spotted an error? Tell us.