Ethereum Slides Toward $2,500 Amid Broader Market Sell-Off
Ethereum fell below $2,600 and tested a key technical support zone as geopolitical tensions triggered a wider cryptocurrency market sell-off.
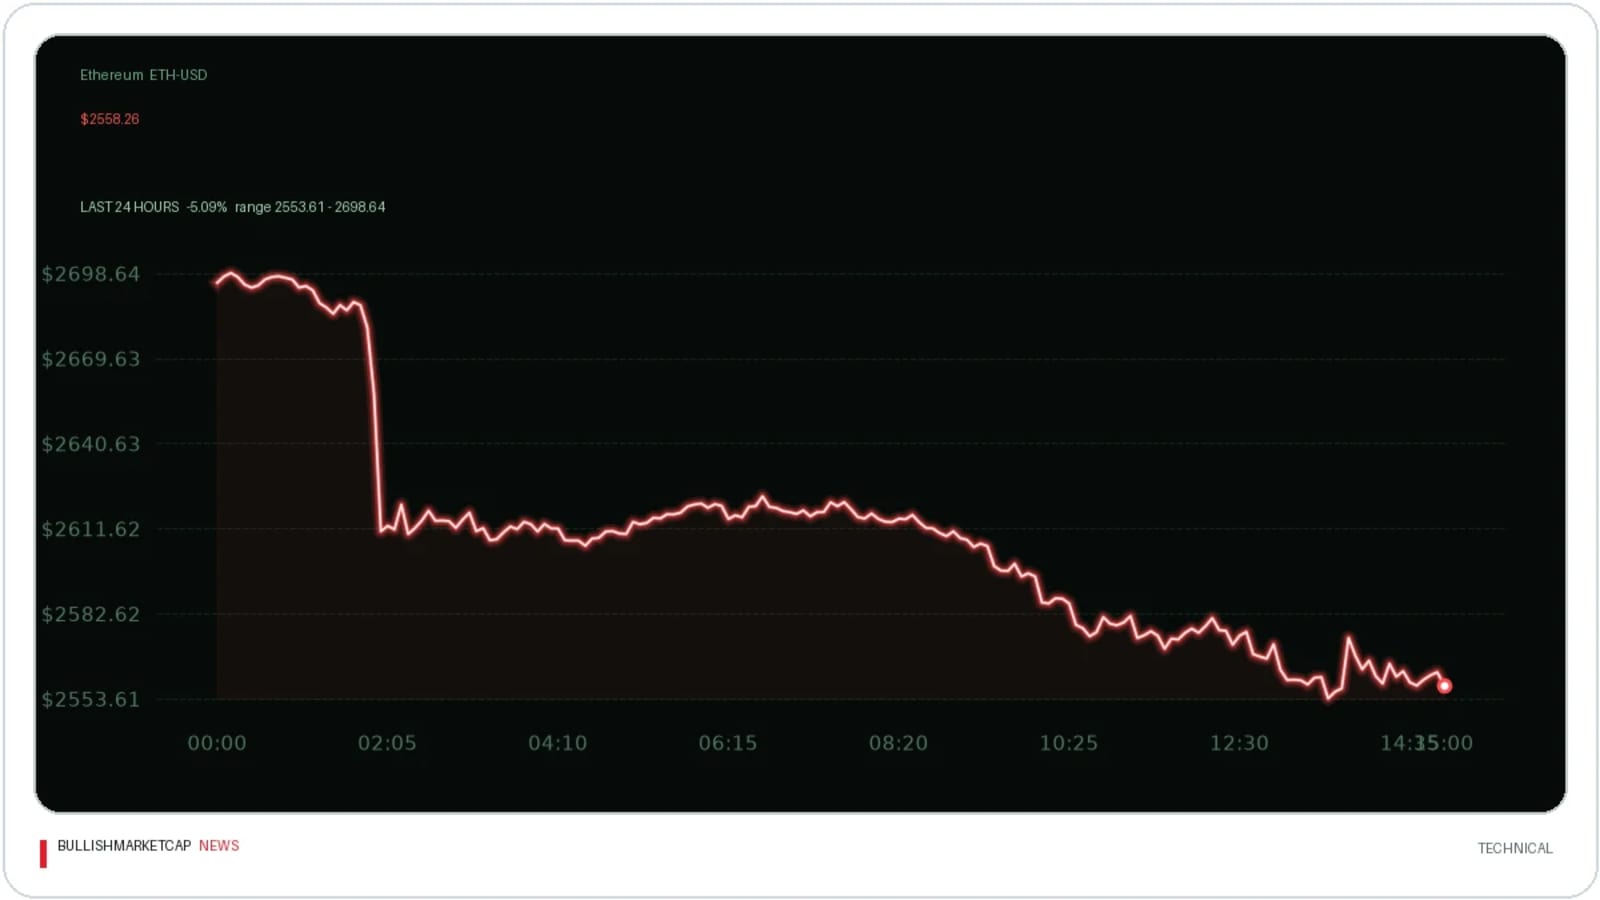
Ethereum traded around $2,565 on Oct. 7, marking a roughly 5% decline on the daily chart after dropping from an intraday high near $2,700, according to CryptoNews. The downward move followed reports of escalating attacks involving oil tankers around the Strait of Hormuz, which sparked a broader risk-off move across global financial markets and the wider cryptocurrency sector.
The sell-off pushed Ethereum through its 20-day simple moving average at $2,684, bringing the token down to test a critical technical support zone between $2,500 and $2,560, which aligns closely with its 50-day simple moving average. Market data cited by CryptoNews showed that more than $400 million in leveraged long positions were liquidated during the market flush, accelerating the downward momentum.
Instant Telegram notifications for large on-chain moves.
Technical Indicators and Momentum
Momentum indicators have weakened following the decline. The daily relative strength index fell to 44.55, moving below the neutral 50 level. On the 4-hour chart, Ethereum traded beneath its lower Bollinger Band, while the average directional index rose to 24.36, approaching the threshold associated with a strengthening directional trend.
Analysts noted that the $2,500 to $2,560 range represents a retest of an earlier triangle breakout. Defending this support zone could keep a potential recovery toward the $3,000 level in play, provided the asset reclaims resistance between $2,680 and $2,800. Conversely, a sustained daily or weekly breakdown below the support area could expose the network to a deeper correction.
Key facts
- Ethereum traded around $2,565 on Oct. 7, down about 5% on the day.
- The token tested a key technical support zone between $2,500 and $2,560.
- Over $400 million in leveraged long positions were liquidated during the market flush.
- The daily relative strength index fell to 44.55.
Source: crypto.news
This article is for information only and is not investment advice. BullishMarketCap news is produced with AI assistance from public sources and reviewed by our editors; see our editorial policy. Spotted an error? Tell us.